Custom Styling
Want to change the look and feel of the chart? Muze provides an easy way for the same.
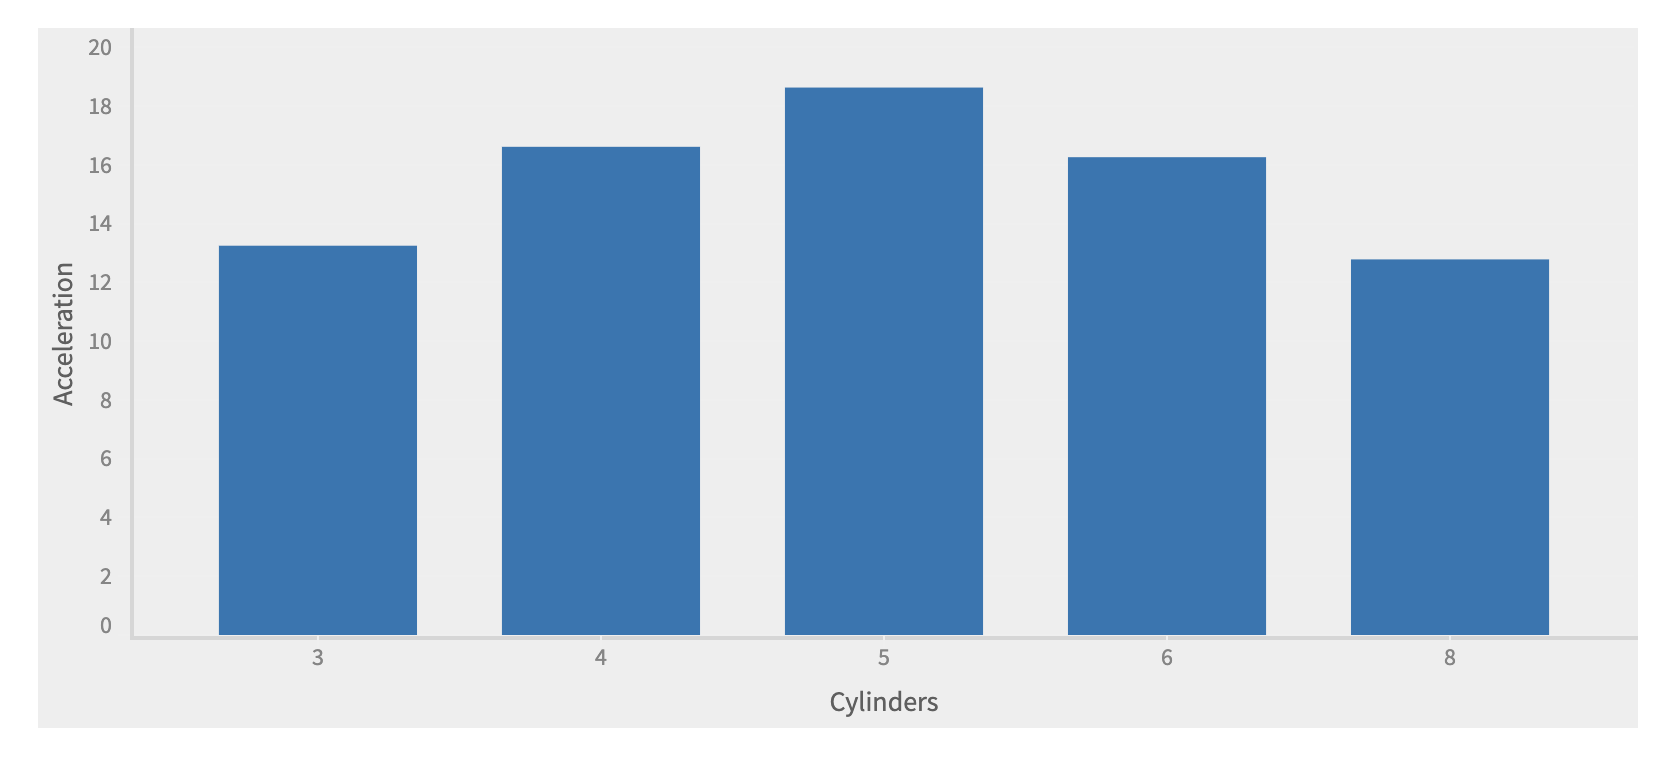
Change the background color of the chart
To change the background color, simply add background-color css rule to .muze-group-container class.
CSS
.muze-group-container {
  background-color: #eee;
}
JavaScript
const { muze, getDataFromSearchQuery, env } = viz;
const data = getDataFromSearchQuery();

const RowField = "Acceleration";
const ColumnField = "Cylinders";

muze
  .canvas()
  .data(data)
  .rows([RowField])
  .columns([ColumnField])
  .mount("#chart");
Change the plot color using color schemes
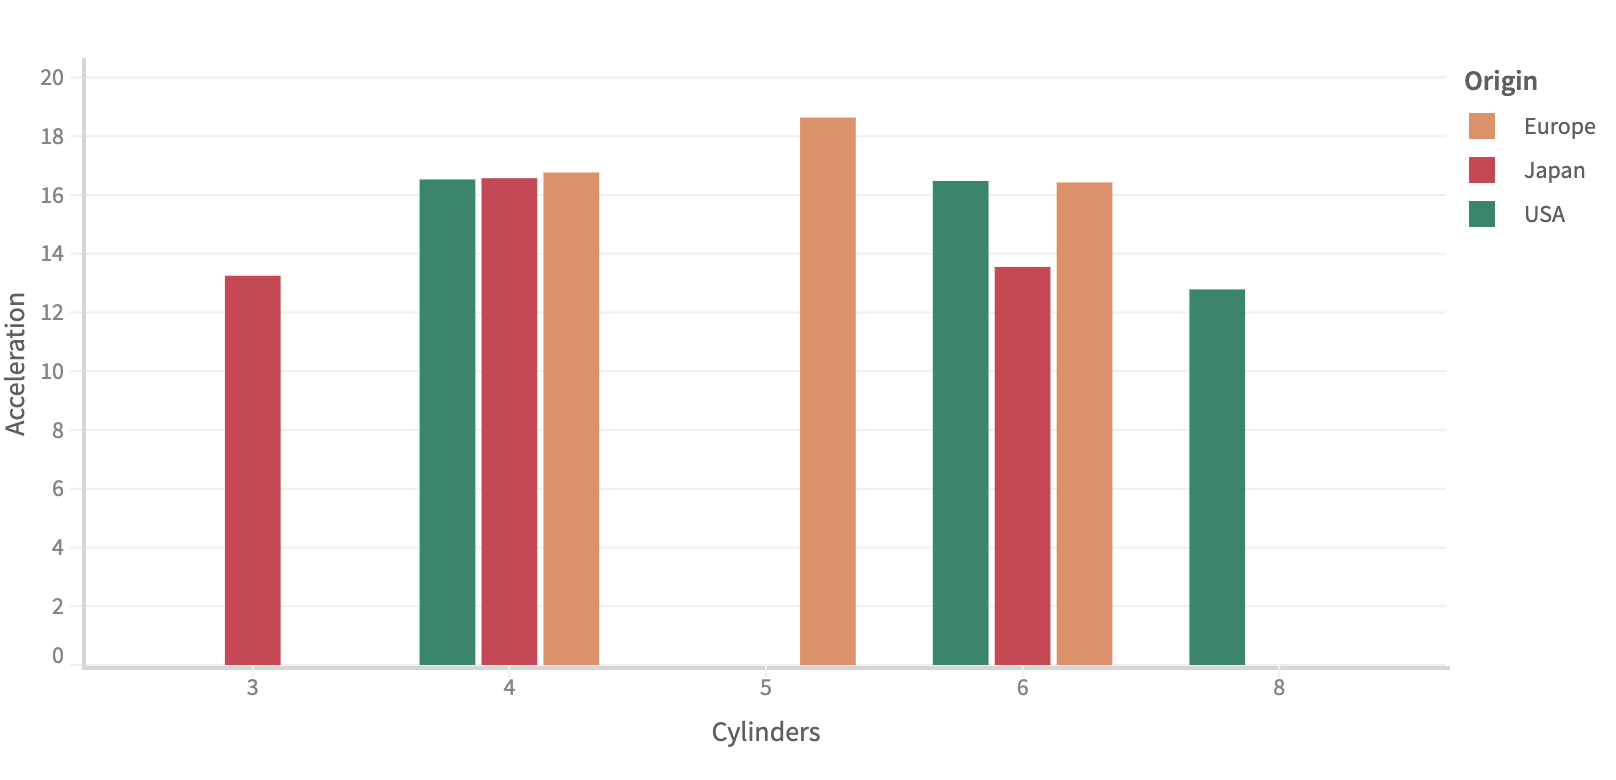
You can add a custom color palette to any chart, using the color configuration.
Pass a field to color, and a range array containing one color each for one unique value of the color field
  .color({
    field: 'Origin',
    range: ['#00876C', '#E88E63', '#D43D51']
  })
const { muze, getDataFromSearchQuery, env } = viz;
const data = getDataFromSearchQuery();

const RowField = "Acceleration";
const ColumnField = "Cylinders";
const ColorField = "Origin";

muze
  .canvas()
  .data(data)
  .rows([RowField])
  .columns([ColumnField])
  .color({
    field: ColorField,
    range: ["#00876C", "#E88E63", "#D43D51"],
  })
  .mount("#chart");
Styling the title and subtitle
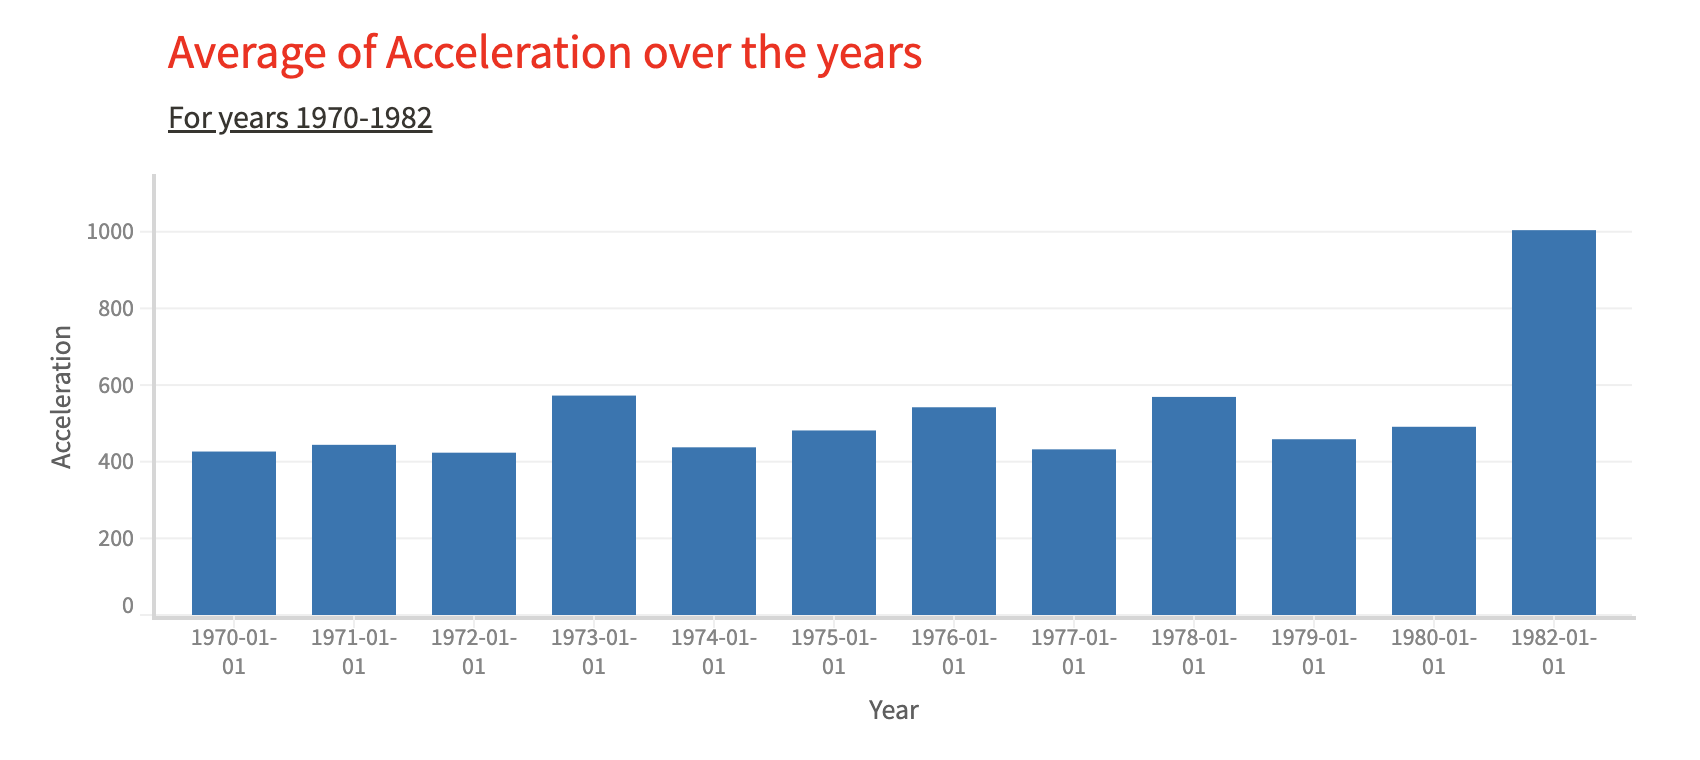
Add css rules in muze-title-cell and muze-subtitle-cell class to style the title and subtitle respectively.
CSS
    .muze-title-cell {
      color: #37352F;
      font-weight: normal;
    }

    .muze-subtitle-cell {
      color: #37352F;
      text-decoration: underline;
    }
JavaScript
const { muze, getDataFromSearchQuery, env } = viz;
const data = getDataFromSearchQuery();

const RowField = "Acceleration";
const ColumnField = "Year";

muze
  .canvas()
  .data(data)
  .rows([RowField])
  .columns([ColumnField])
  .title("Average of Acceleration over the years")
  .subtitle("For years 1970-1982")
  .mount("#chart");
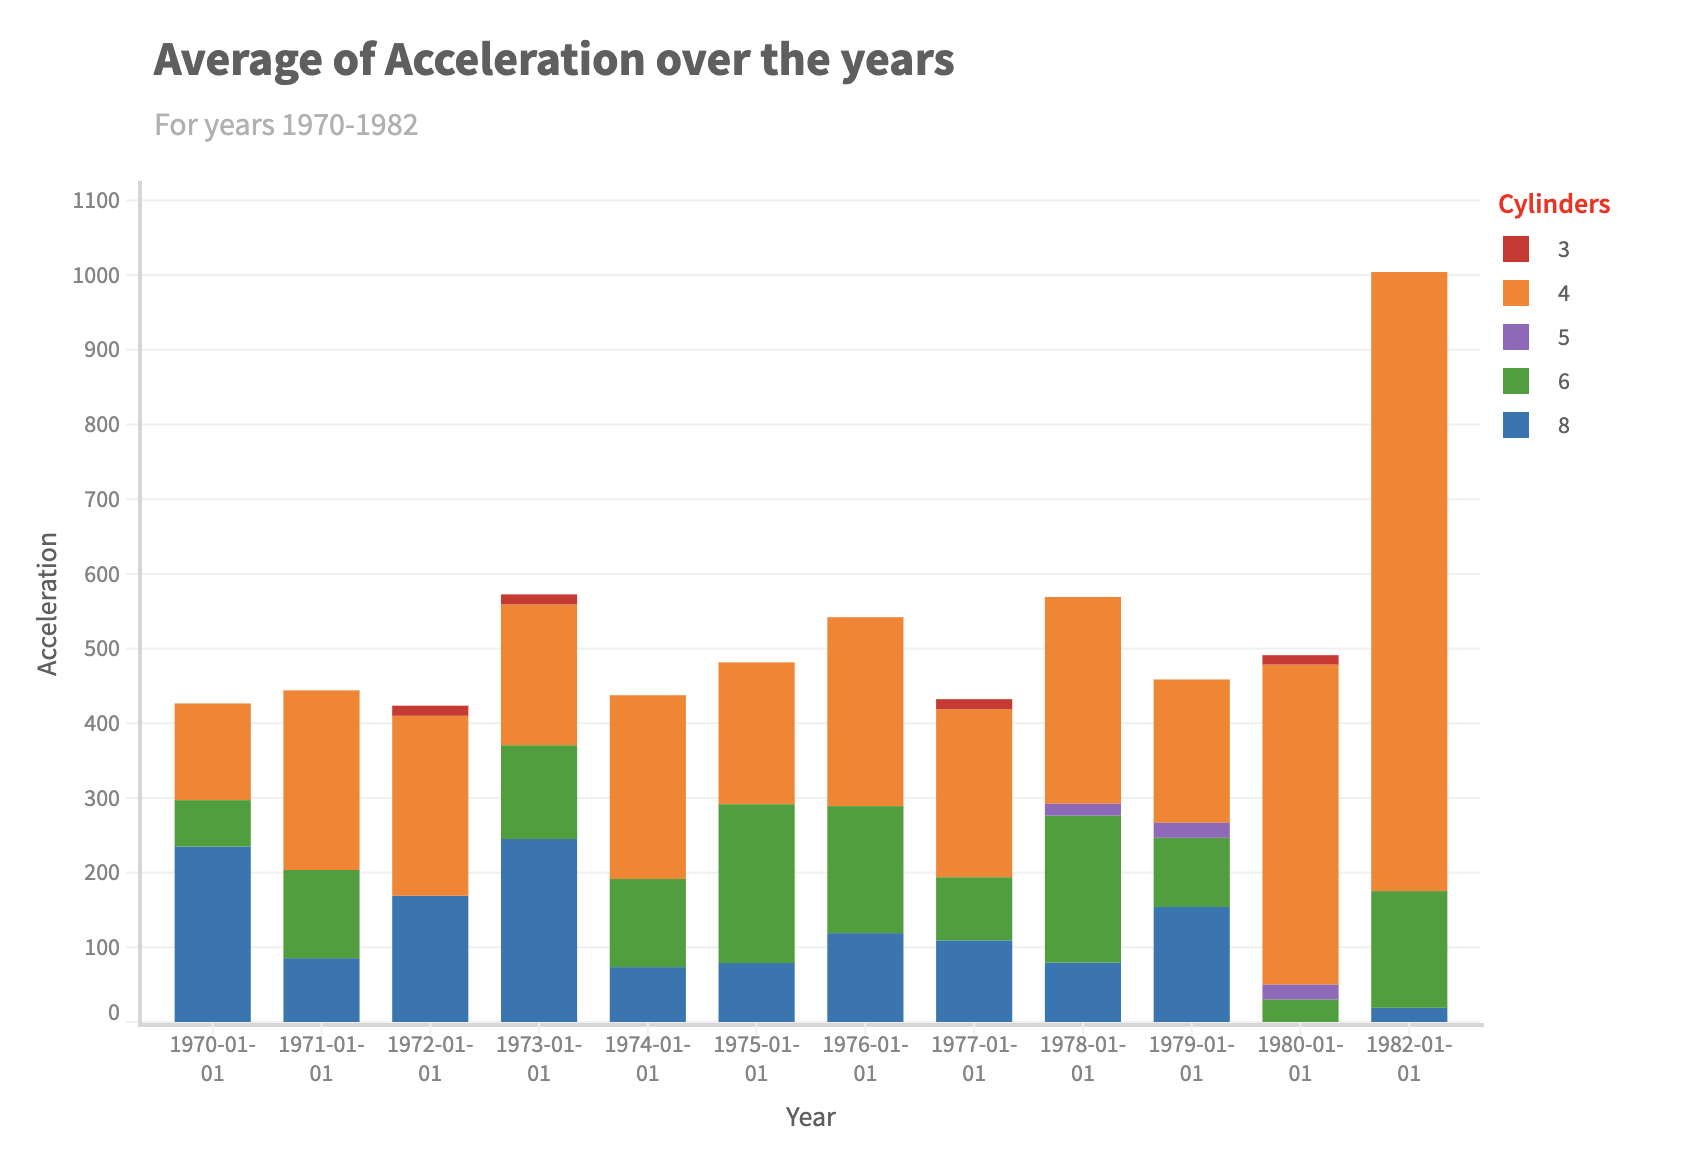
Styling the axis and legend
Add css rules in muze-legend-title-text class to style the legend title.
Adding on to the previous sample, we will color the chart by Cylinders and color the legend title.
CSS
    .muze-legend-title-text {
      color: red;
    }
JavaScript
const { muze, getDataFromSearchQuery, env } = viz;
const data = getDataFromSearchQuery();

const RowField = "Acceleration";
const ColumnField = "Year";
const ColorField = "Cylinders";

muze
  .canvas()
  .data(data)
  .rows([RowField])
  .columns([ColumnField])
  .color(ColorField)
  .title("Average of Acceleration over the years")
  .subtitle("For years 1970-1982")
  .mount("#chart");